The Hertzsprung-Russell (H-R) diagram is the most important in astronomy. It plots all the stars against their luminosity, temperature, mass and spectral class. The diagram was developed by the Danish and American astronomers Ejnar Hertzsprung and Henry Norris Russell around 1913. Their independent studies found that a star’s spectral type and colour corelated with temperature.
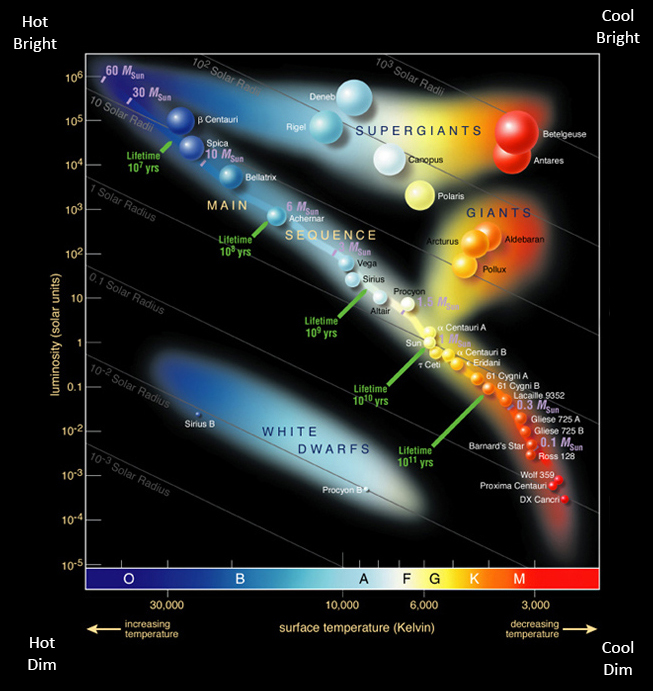
This is the most comprehensive and is based on the original graphic created by the European Southern Observatory – 19th June 2007. Additions by an unknown source include spectral class, lifetime and solar radius lines, and names of many stars. I added text: Hot/Bright etc and created larger black frame.
They also found that 90% of all observed stars could be grouped into the so-called “main sequence”. This group lies along the diagonal region extending from the upper left of the diagram (hot, bright stars—visually blue) to the lower right (dim, cool stars—visually red). The sun lies near the middle of the main sequence.
This populous region also correlates with mass: the largest stars at the top left, diagonally down to the bottom right, and the smallest stars. From the study of the diagram you can also see that supergiants, giants and white dwarfs fall outside the main sequence. Blue supergiants are still hot. Canopus, a triple star, is blue-white. Polaris is a little cooler and yellow. The red supergiants shown are Antares and Betelgeuse, which by their colour are a lot cooler. On the other side of the major highway lie the white dwarfs, which are very small but have high temperatures.
Protostars with the right credentials enter the main sequence when they start to burn hydrogen. Their temperature rises and their mass decreases. Many members of the main sequence enjoy a long, stable life, measured in billions of years. For example, in the middle is Sirius, which will have spent a billion years here and, further down, the sun which will have spent 10 billion years in the main sequence before departing. Also important to note is that those stars with a greater mass will have a shorter, but nevertheless stable life. As soon as the hydrogen in the core is depleted, and hydrogen shell burning (of the atmosphere) begins, the stars leave the main sequence, evolving into red giants or supergiants; they move right and upwards in the diagram as their size increases and their temperature falls.
Nuclear fusion occurs in a process called proton-proton reaction; and this period is called the hydrogen-burning stage. This is when four protons join together and two are converted into neutrons; and a 4-Helium nucleus is formed. During this process, some matter is lost and converted into energy (conforming to Einstein’s equation). At this point, the star stops collapsing because the outward force of heat balances the crushing force of gravity. Mid-sized stars remain in the main sequence in this stable equilibrium for billions of years.
As we have already seen the mass of a star determines its lifespan and the sequence of events that take place in its lifetime. Most stars stay in the same place on the H-R diagram for most of their lives. As their core becomes exhausted, so their processes start to plunder the outer layers for more nuclear energy. The radiation generated causes the outer layers to balloon. They increase in brightness and begin to cool to become red giants and leave the main sequence. Eventually they will blow off their surplus gases, shrink, and become extremely small – a white dwarf. This is the most common lifecycle. Our Sun will follow this route.
Bigger stars keep their bloated surfaces hot. This makes them appear orange, yellow and even blue or white. Of course their gravity is far greater, and this puts a huge amount of strain on the core, raising the temperature and speeding up the fusion process. These heavy blue stars are very bright, but only live for a relatively short time. After the energy from the deuteron-hydrogen fusion process ends, the star begins to contract further, and the temperature and pressure subsequently increase even more. Nuclear fusion occurs between the hydrogen and lithium and other light metals, although this process is short-lived. Contraction continues and the extreme high temperature and pressure cause the hydrogen to transform into helium through the carbon-nitrogen-oxygen cycle. Most of these stars are more than eight times solar mass and they quickly leave the main sequence where they end their lives in a supernova.
Blue is the hottest colour, then white, yellow down to the coolest, red. On the main sequence this also correlates with reducing luminosity, and lower temperatures: from above 30 000°C down to 2 500°C. This is shown very clearly on the Hertzsprung-Russel diagram. There is also a correlation as regards size. White dwarfs are typically below one solar mass. They are off the main sequence, towards the bottom of the diagram. Above the main sequence in the diagram are those stars of greater than 100 solar mass, blue supergiants and red giants. It is the stars between these solar mass extremes from, say, 2 to 100 solar masses where we find the main sequence stars.
As you can see mass is a very important differentiator, perfectly demonstrated by the Hertzsprung-Russel diagram.
| Stars: the Relationship of mass, luminosity and lifespan | ||
|---|---|---|
| Solar mass | Solar luminosity | Lifespan (years) |
| 0.06 | 0.0001 | >5 trillion |
| 0.125 | 0.001 | >1 trillion |
| 0.25 | 0.010 | 250 billion |
| 0.50 | 0.10 | 50 billion |
| 1 | 1 | 10 billion |
| 2 | 10 | 2 billion |
| 4 | 100 | 400 million |
| 8 | 1 000 | 80 million |
| 16 | 10 000 | 15 million |
| 32 | 100 000 | 3 million |
| 64 | 1 million | <1 million |
As it is said, ‘The bigger they are the further they fall.’
Lifespan of stars
| Lifespan of stars | |||
|---|---|---|---|
| Solar mass | Type | Lifespan in years | Average surface temperature or range |
| >20 | Blue supergiant | Less than 6 million | 10 000°C - 50 000°C |
| >10 | Red supergiant | Less than 30 million | 3 500°C - 4 500°C |
| 5 - 10 | Blue giant | 30 million to 180 milliom | 10 000°C or more |
| 0.3 - 8 | Red giant | 55 million to 200 billion | 3 500°C - 3 600°C |
| 0.3 - 1.4 | White dwarf | 4.3 billion - 200 billion | 8 000°C - 16 000°C |
| 1.0 | Yellow dwarf | 10 billion | 5 000°C - 7 500°C |
| 0.08 - 0.8 | Red dwarf | 17 billion to 5.5 trillion | 2 500°C - 4 000°C |
| <0.08 | Brown dwarf | At least 5.5 trillion up to infinity | 725°C - 1 725°C |
Once a star is on the main sequence it will remain there in a stable state until it has used up its hydrogen. At this point the star enters the “instability strip”. And what they do there, again, will be determined by their mass. Note that the correlation between the mass of a star and its surface temperature is only valid for main-sequence stars. Stars outside this happy family can have a wider range of temperatures.
A supergiant is big enough to form an iron core, and then calls it quits in a spectacular supernova. This totally destroys the star, and the materials are dispersed back into the primordial soup to start the process again. During the disaster event metals heavier than iron are created. So something good comes out of it: frying pans, computer monitors and alarm clocks, for example.
And size really does count. A star ten times the mass of the sun will consume its hydrogen one thousand times faster. So the bigger you are the shorter you live. On the other hand a white dwarf of a solar mass of less than 1.44 can live indefinitely.
| Lifespan and the solar mass of a star | ||
|---|---|---|
| Mass | Lifespan | Spectal type |
| (In solar masses) | (in years) | (typical) |
| 30 | 2 million | O7 |
| 20 | 6 million | O9 |
| 10 | 32 million | B4 |
| 3 | 370 million | A5 |
| 1.5 | 3 billion | F5 |
| 1 | 10 billion | G2 |
| 0.1 | Trillions | M7 |
Back to Top
By Nigel Benetton, science fiction author of Red Moon Burning and The Wild Sands of Rotar.
Last updated: Friday, 19 March 2021